Engineering teams often face an observability disconnect: despite having dashboards for embedding latency, RAGAS scores, and reranker precision, production deployments with improved component metrics frequently fail to lift user satisfaction.
Here’s a common pattern:
- Days are spent on optimizing a specific component (e.g., improving reranker precision by 5%)
- The update is deployed to production
- User satisfaction metrics (Customer Satisfaction (CSAT) or Resolution Rate) remain flat
The problem isn’t a lack of validation; it is validating in a vacuum. Component metrics are often treated as the goal rather than as diagnostic signals for the actual product.
End-to-End evaluation is not just a final quality check; it is a prioritization engine. By linking business outcomes (what the user cares about) to component metrics (what you control), you can identify which technical improvements will actually impact the user experience.
The probability leak
AI pipelines are probabilistic chains.

The diagram illustrates error compounding in a typical RAG pipeline. Each component’s failure probability multiplies, creating a “probability leak” where system-level performance degrades faster than component metrics suggest.
This creates a hidden cost inefficiency. If the embedding model fails to capture the user’s intent, the downstream components (reranker and LLM) are processing noise.
Downstream improvements cannot recover upstream information loss.
This failure mode requires systematic diagnosis. The Drill-Down methodology provides a framework for isolating bottlenecks by working backwards from business metrics.
The methodology: drill-down evaluation
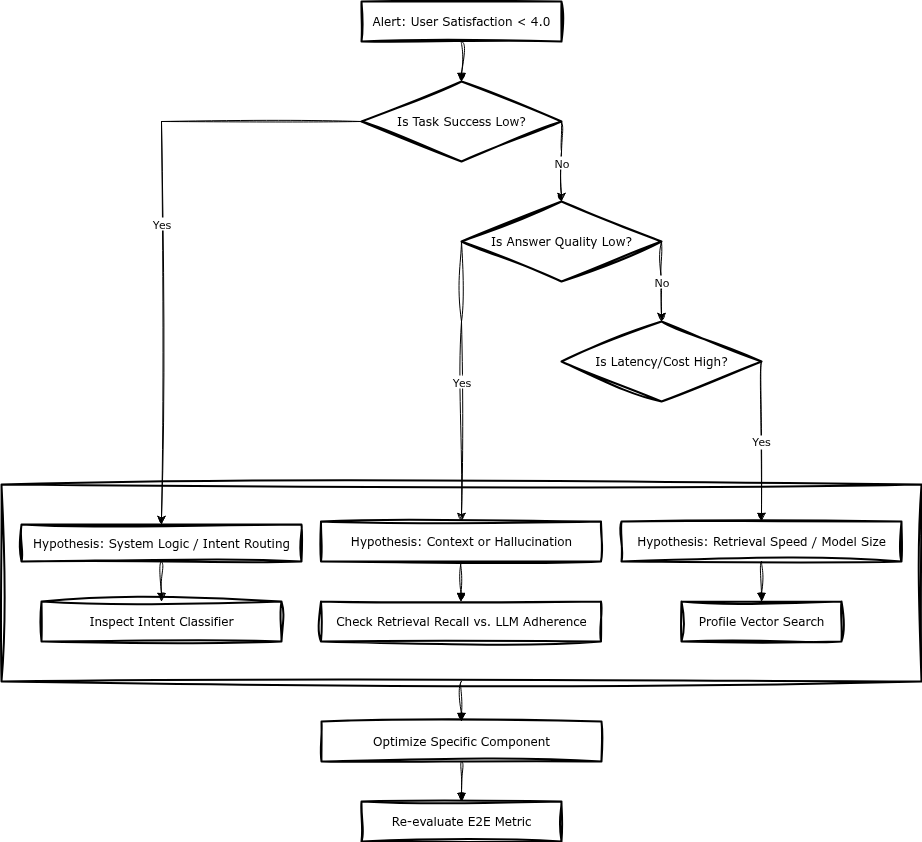
To avoid wasted engineering effort, evaluation should work backwards from the business metric. Do not start by asking “How do we improve retrieval?” Start by asking “Why is the Task Success Rate low?” and drill down until the technical bottleneck is isolated.
Step 1: defining success criteria
Effective evaluation requires metrics that proxy user value, not just system output.
Output Metrics (Operational):
- Tokens generated
- Latency per chunk
- Number of docs retrieved
Outcome Metrics (Business):
- Code Generation: Did the user copy-paste the code block?
- Support: Did the conversation end without a “talk to human” request?
- Search: Did the user click a citation?
Step 2: the golden dataset
Outcomes cannot be evaluated with simple unit tests. A “Golden Dataset” must capture intent and business constraints.
Instead of complex evaluator classes, structure test data to reflect business needs:
{
  "query": "Can I return the laptop if I opened it?",
  "business_constraints": {
    "must_contain": ["restocking fee", "14-day window"],
    "must_refuse_if": ["damaged by user"],
    "tone": "empathetic but firm"
  },
  "expected_outcome": "Policy_Clarification_Success"
}
The outcome should be a binary Pass/Fail check: the test passes only if all business constraints are met.
Note on Evaluation Methods: Avoid relying solely on LLM-as-a-Judge for E2E metrics. Use deterministic checks where possible: JSON schema validation, entity extraction, user behavior signals (copy-paste rate, click-through). LLM-as-a-Judge is useful for nuanced tasks, but it introduces variance and cost. Prefer rule-based evaluators for binary outcomes (e.g., “contains required field”, “response time < threshold”).
Step 3: correlation and conditional analysis
This is the critical diagnostic step. Once E2E results and component logs are collected, the goal is to find which component metric correlates with E2E failure.
Scenario A: Direct Correlation
If Retrieval Recall has a high correlation (e.g., 0.7) with Task Success, optimizing the embedding model is the correct priority.
Scenario B: The Dependency Trap (Conditional Analysis) In sequential chains, direct correlation can be misleading. A reranker might be performing perfectly (giving high scores to the “best” available docs), but if the Retrieval step only returned irrelevant documents, the User Outcome will be 0.
If you simply calculate Correlation(Reranker_Score, User_Outcome), you might see near-zero correlation and wrongly assume the reranker is irrelevant.
Solution: Apply conditional analysis. Evaluate the reranker’s impact only on the subset of queries where Retrieval was successful (Retrieval_Recall > 0.8).
Case study: the iteration trade-off
Consider a Deep Research Agent where the engineering team must determine the optimal number of research loop iterations (1, 2, or 3).
The Engineering View: “3 iterations are superior. The system gathers 40% more documents, and Retrieval Recall hits 0.95.”
The Business/E2E View: Applying Drill-Down evaluation against User Satisfaction and Cost reveals a different reality:
| Iterations | Retrieval Recall | Satisfaction | Cost |
|---|---|---|---|
| 1 | 0.75 | 6.2/10 | $0.12 |
| 2 | 0.88 | 8.4/10 | $0.28 |
| 3 | 0.95 | 8.5/10 | $0.58 |
The Insight: Moving from 1 to 2 iterations yields a significant jump in satisfaction (+35%). Moving from 2 to 3 yields negligible user value (+1%) but doubles the cost. Without E2E metrics, the team might ship “Iteration 3” based on superior recall scores, unknowingly degrading the product’s unit economics.
Technical implementation: lean instrumentation
A minimal logging pattern is sufficient to enable this analysis. The key is to store component metrics alongside outcome metrics in a flat structure.
# Minimal structure for Drill-Down analysis
log_event({
    "trace_id": "abc-123",
    "component_metrics": {
        "retrieval_score": 0.85,
        "latency_ms": 450,
        "token_count": 1200
    },
    "outcome_metrics": {
        "user_rating": 5,
        "task_resolved": True,
        "est_cost_usd": 0.04
    }
})
By storing this data, you can run the necessary SQL/Pandas analysis to detect bottlenecks without complex observability platforms.
Example SQL Query for Correlation Analysis:
-- Find impact of reranker when retrieval succeeds
SELECT
    retrieval_score,
    AVG(CASE WHEN task_resolved THEN 1.0 ELSE 0.0 END) as success_rate
FROM log_events
WHERE retrieval_score > 0.8  -- Conditional: only when retrieval works
GROUP BY retrieval_score
ORDER BY success_rate DESC;
This query shows how to apply conditional analysis: it evaluates correlation between component metrics and outcomes, filtering to cases where upstream dependencies succeeded. This avoids the dependency trap described in Step 3.
Summary
- Component scores mask system failures. High precision in one component does not guarantee a successful system if the input to that component is flawed
- Work backwards. Start with the Success Criteria (User Satisfaction/Task Success). If it falls below target, drill down to find the specific component causing the bottleneck
- Handle dependencies. When analyzing pipelines, remember that downstream performance is conditional on upstream success
- Prioritize via impact. Only optimize components whose metrics demonstrably correlate with business outcomes
System value exists only at the End-to-End level. Optimization without this context is effectively tuning parameters at random.